Subscribe in a reader

Bookmark and Share

Friday, September 25, 2009

GBP/JPY Update: Hourly, H4 and Daily Charts

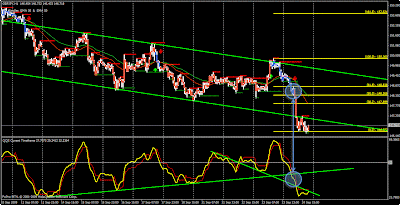
The pair is at support, almost touch 38.2% Fibonacci retracement of 118.8 to 163.06 at 146.16. The outlook remain bearish as long it stay below channel. Getting back inside the channel will turn the outlook to short term retracement to test the resistance. Target remains at 50% Fibonacci level at 141 area. Cable has been moving in negative correlation with USD/JPY most of this week, and we saw GBP/JPY stucked in between, resulting in volatile swings. Therefore, we need careful approach for the pair.

GBP/JPY D1 Chart
GBP/JPY H1 Chart
GBP/JPY H4 Chart


Saturday, September 12, 2009

GBP/JPY Daily & H1 Chart: What A Week..

So, after 4 days of consolidation, the pair break the support trendline and drop to 150.48 before closing the week at 150.99. I added a trendline since my last post. On daily TF, we can see that the 23.6% Fibonacci level proved to be a strong resistance. The breakout also give assumption that the pair would have another move to test the support levels (see D1 chart).

GBP/JPY H1 Chart

GBP/JPY D1 Chart


Wednesday, September 9, 2009

GBP/JPY: There is the Breakout

The pair has just broken the support trendline and I'm hoping to see a test to 151 support, which is the AB projection from C. The pair almost broke the resistance earlier actually, with the QQE indicator also breaking the trendline. However the price failed to give a clear breakout and I decided not to enter.

Ok now, the outlook is bearish, but choppy movement should be anticipated while Cable still moving north. Have a nice day guys..


GBP/JPY: New Channels In Hourly Chart


Since the pair has broken the downtrend channel, we gotta need new chart setup. Right then.. here you go. Please look at the screenshot. I started by connecting PL (previous low) and HL (higher low) to get the current uptrend trendline. Next, I draw trendline from PH (previous high) to HH (higher high). Then I make a parallel trendline of PH-HH from PL to get an equidistant channel. Wow..I'm a bit confused myself :D Bear with me for a minute ok. I also draw another trendline from HH to LH (lower high), and put a parallel one from PH (previous high) to create another channel. Phiuuhh... Man.. that was exhausting.. Maybe its better if you just take a look at the screenshot ;P Happy trading guys!


Friday, September 4, 2009

GBP/JPY H1 Chart: Sell No More


The downtrend channel on hourly chart was broken again for the second time yesterday. The 30 EMA has crossed above 50 EMA also. However, the pair did make a lower low since my last post. Support for now is the Wednesday low at 149.02. I don't know the pair direction for now while the it still seems like a downtrend in 4 hour and 1 day time frame. The latest NFP will be release later on US session. Ok! Got to go now. ;D

Tuesday, September 1, 2009

GBP/JPY H1 Chart: Sell Again


Above is the updated screenshot of my last analysis for GBP/JPY in hourly TF (see post). The pair touch the resistance trendline again and I took it as entry signal for another short position. I also add outer trendline to measure the deviation. This can be the tolerance limit for SL if the pair break the inner trendline.

Looking at yesterday's performance of GBP/JPY, the sellers lose the ground after the pair touch 150.16 with another low at 150.05 after a few candles. The sterling had been in favor through the Europe and US sessions. As for today, well, we'll see.. :)