Subscribe in a reader

Bookmark and Share

Saturday, May 31, 2008

26 - 30 May

Obviously, this week result is not good. I lose 104 pips this week. Actually most of the signal on GBP/JPY was a good signal, but I lose much on GBP/USD:( Let's take a review on the signals.
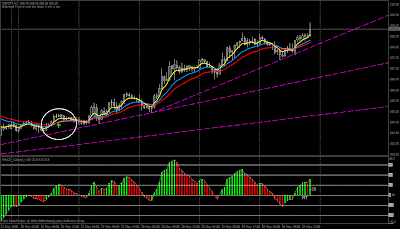
The signal appeared on Monday and the trend remain until Friday. It was a good week really. Now let's see GBP/USD this week.

I short the pair on Wednesday, just after the news. I really thought I can get 30 pips from my entry, because on the other hand, EUR/USD kept on falling. I was wrong. The pair reversed to test the previous high where I open my second position. After a few hours I close all the positions because I was afraid it may not coming back down. Again, I was wrong. The pair drop on the next day at the Tokyo session. However, the pair break the channel resistance on Friday so first target is at 1.9845 area.

Okay back to GBP/JPY..
We got a full body candle above the trendline. Maybe now the pair will test for 215.xx area, which is 38.2 retracement of the 251.09 to 192.54 drop. That's all this week, see you on June :)


Previous Week

Stop Loss Using MA Crossover Signal

I just notice something about the MA crossover signal indicator. It seems that the signal appears at some point that can be use as stop loss level. The signal is 13 EMA and 21 EMA crossover and I haven't try with other MA period and I use 1 hour chart. This is what I saw:


You can see on the right side that the EMAs crossed again when the SL level got hit. Here is another.


The particular signal above could really help in that kind of price movement. You can also set your position sizing based on that signal. Well, I cannot post all of my samples here so you can download the indicator below and try it yourself. Have a great weekend all..


Position Sizing for Breakout System

Click here to see the breakout system.

Now, the Stop Loss is simply the opposite signal. So if the long order triggered, then the Stop Loss would be the short order price, which would triggered the short order.
Everyday we'll have different range of Stop Loss. So if you want to limit your risk per trade, you will have to calculate the quantity.
After you know the high and low, and you adjust it with the spread, you can find the range,which is the Stop Loss.

Here is the example from yesterday on GBP/JPY:


Range : H - L = 72 pips
Equity : $100
Risk : 5% = $5
So, the quantity for a position with 5% risk on a 72 pips Stop Loss will be
($5/72) * Quantity Contract Size. Let say it's a mini account so it will be:
($5/72) * 10000 = 694.44 Quantity which is 0.06 Lot.

Actually it is not just for a breakout system, as long you know your stop loss. And this has nothing to do with risk-reward ratio, it is only to limit the risk. Okay hope this information is useful.. :)


Wednesday, May 28, 2008

Indicators for Metatrader

Guys, I added the 'Downloads' section. This will be the first post under that label. Here I got indicators for MT. I can't remember where I downloaded them, I think it was a forex website or something. I like to browse for MT4 indicators on the web. I like to try those different indicators on my chart, try to learn something from them and eventually I hope I can find my ultimate preferences of indicators. Not the ultimate system, just my ultimate preferences of indicators, which should fit my style of trading. So feel free to download them okay:)


Saturday, May 24, 2008

Weekly Breakout

Hi guys, I found this system on Forex Factory. The system is for GBP/JPY. The system use the last 2 candles of the week on 4 Hour chart to determine the high and low. I was actually notice it myself so I was quite surprise when I saw the system on the Forex Factory. It is nice to know that someone else notice it too. :) Anyway the chart will look like this:

I use stop order above the high and low to trade this system, just 1 pip away. I also like to wait for the first candle on the next week to set the high and low, so the high and low will determine by 3 candles. Please check out the system on the Forex Factory here. The guy got details for target etc. :)

Oh, and the example above is from a good week, this week went ugly.. ;P See you guys next week..

19 - 23 May

The pair continued it sideway move. It was not until Thursday when it make a new high for the last 2 weeks. The pair went for 206.54 without a significant retracement, at least not significant enough for me because the price didn't cross the 5 EMA at all. However, trendlines proved to be worthy. I got the breakout align with 5 EMA cross 13 EMA and 21 EMA, gave me an entry signal. The target should be the next trendline but my plan was 50 pips for each entry. The pair went back down until 204.17 on the next day, at 61.8 retracement level.


My result ends up well for this week, gain 176 pips and reach my 3% average growth target. I said last week that I expect the pair break the 202.60 support. Well..it was a strong support ;P USD/JPY did break my trendline and bounced on the trendlines. GBP/USD break my Daily trendline although it already touched the Daily upper Bollinger Bands. Okay thats all. Have a nice weekend people.. :D


Previous Week

Sunday, May 18, 2008

12 - 16 May

The pair reversed since Monday and was going sideways for the rest of the week. The 13 and 21 EMA cross gave late signals in this situation while the 5 and 13 EMA cross generate better entry signals. I lose 298 pips this week :P I closed 2 short positions near that red arrow on Friday, just before the price went back down :( GBP/USD resistance is at 1.9630 and USD/JPY resistance is at 104.50, so I expect GBP/JPY will fall next week:) Well that is all have a nice weekend guys!


Previous Week

Thursday, May 15, 2008

Daily Breakout Backtest

I made back testing on GBP/JPY for the Daily breakout system regarding my post about the system. The data start from 4 September 2000 (ODL Metatrader). I test for 10 pips target from 1 pip above the previous day high and 1 pips below the previous day low. So there are 3 summaries, whether the price reach target, breakout but didn't reach the target, or no breakout. You can download the excel sheet here.

Sunday, May 11, 2008

5 - 9 May

I said on my previous post that I want to use the EMA. I also said that a good trend can last for few days. Well, it has been a good week. The 13 EMA cross the 21 EMA on Monday from above and it remain below the 21 EMA until the end of the week. And because the price kept on falling, some of my entries were based on trendline breakout. Ok, that's all. Have a nice weekend.


Previous Week

Tuesday, May 6, 2008

Moving Average Based System

I always like Moving Averages. I am currently using the 5, 13, and 21 EMA. I always tried to find my preference of EMA. I tried 89, 200, 55, 28, and other MA period that people use. But, unlike other MA based system, I don't combine oscillator indicator. Actually I do, but I somehow overlook the oscillator very often. ;P

Well, as you know, MA based system is quite frustrating in sideways market. And since I am lack in using oscillator as confirmation, I use more MA instead. In the 5, 13, and 21 EMA system that I favor now, the 13 and 21 is the confirmation. In the GBP/JPY hourly chart, these EMAs crossed at least once a day, meaning that the 1 hour trend changes once a day. A good trend can last for few days.

For entries, I use the 5 EMA and trendlines. After I enter when the price touch the 13 or the 21 EMA and close back crossing the 5 EMA.


Profit target seems to be a problem for me. To get the maximum profit, I should have follow the trend. But, after 50 pips, I cannot help myself to close my position. :P So I guest 50 pips is my target.

Another problem is stop loss. Well I'm not a stop loss master so I think for the moment my stop loss is either previous high/low or when the opposite signal appears. I am reading about stop loss with ATR (Average True Range) based but I'll use the previous high/low for now. Oh and please share your own preference of Moving Average and how you use it. Okay that is all guys. Bye.. :)